Slow and steady: Ireland’s competitiveness, five years on
One of the mantras of Celtic Tiger Ireland was that it was a rip-off Republic. And indeed, by 2006, Ireland had overtaken Finland to become the most expensive place in the eurozone for consumer goods.
Mid-2008 marked a turning point, however, and the combination of global economic turmoil and local economic depression meant that prices fell for over 18 months from until early 2010. Regaining competitiveness with our currency peers does not necessarily involve deflation, however. It can instead be brought about by more moderate inflation in Ireland than in other parts of the eurozone.
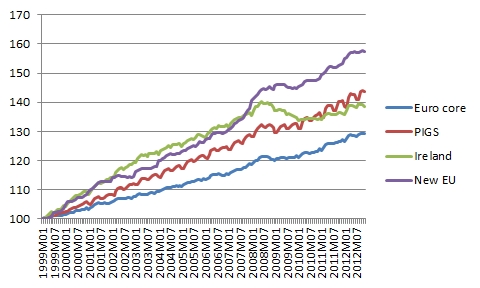
And since 2010, that is what has been happening. The first graph below shows consumer price levels (as measured by HICP, which is designed to be comparable across EU member states) in four economic groupings. In addition to the eurozone core and Ireland, also shown are the PIGS countries (the “I” here refers to Italy) and the new EU member states (largely outside the Euro for the period shown).

In the first period, from 1999 to early 2004, Ireland acted like a new EU member state. Consumer prices increased by 22% in that period in Ireland, compared to 20% on average in the new EU states, 14% in the PIGS and 9% in the eurozone core. The second period, from early 2004 to mid-2008, Ireland actually saw more moderate growth in prices: 14%, in line with other PIGS (15%), below the new EU states (21%) but above the core (11%).
In the 50-odd months since August 2008, Ireland has been unique. Prices in Ireland have actually fallen by 1% in that period, while they have risen by almost 10% in both the PIGS and the new EU member states. In the Eurozone core, they have risen by 6% in the same period.
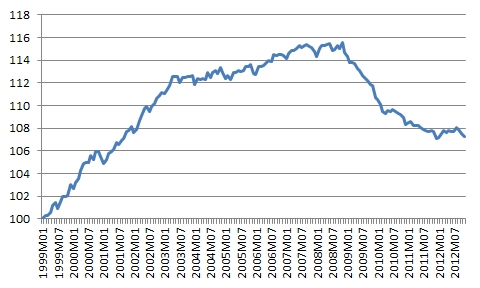
A direct comparison of Ireland and the eurozone core shows this competitive readjustment more clearly. The second graph below shows prices in Ireland relative to the eurozone core (=100) from 1999 on. Ireland’s price competitiveness worsened by 12 percentage points in that early period (up to 2003) and by another four percentage points (roughly) between then and 2008. In other words, it was the early years of the eurozone when the damage was done to Ireland’s cost competitiveness.

Of that 16-percentage point worsening in Ireland’s competitiveness, roughly half has since been eroded away. Compared to 1999, Ireland’s price levels have risen by 8 percentage points more than the Eurozone core. (This hides differences by particular categories of goods and services – a subtlety that matters a lot!)
In truth, that 8% figure probably overstates things slightly, as HICP excludes accommodation costs, which are the single biggest component of consumer expenditure. Both rents and house prices in Ireland at currently at levels comparable to 2000, which is unlikely to be the case in any other European economy. Perhaps the only other candidate for such stable figures is Germany, but its property market has heated up the last two years, meaning costs are a good bit above 1999 levels.
In short, it has not been fun – as inflation is associated with expansion and deflation with contraction – but Ireland has put in five hard years of competitive readjustment. With prices on hold, so are wages, which boosts Ireland’s attractiveness for FDI. The sting in the tail is that with inflation throughout the eurozone so low, any further competitive gains are going to be even tougher and slower.