Economists like to talk about the period from the 1980s until the 2008 Global Financial Crisis as the Great Moderation, a period of low volatility and stable economic growth. Even now, so soon after its ending, it is talked about in almost wistful terms, the implication being that the world economy may not have for a long time such relatively high economic growth with such low volatility. The post-2008 world has some parallels with the post-Oil Crisis world, which looked upon the 1950-1973 period of high growth in the West after World War 2 as a “Golden Age“.
How true is this perspective? Six weeks ago, the IMF released their latest World Economic Outlook, which outlines the relative size and growth prospects for 180 economies in the world. For any “Westerners” interested its economic future, it should be compulsory reading, in particular Chapter 2, which talks about the global economy’s different regions.
I’ve threaded together the IMF’s dataset, which goes back to the early 1980s for many countries, with Angus Maddison’s dataset of historical economic growth, to compile a picture of real growth in the world economy from 1980 to 2015. The headline figures show a world economy that in real terms is going to grow from $30 trillion in 1980 to $100 trillion by 2015, a more than trebling of economic activity. While I broke down the numbers to look at four time periods, 1980-1991, 1991-2001, 2001-2008 and 2008-2015, the figures show perhaps just two periods. Growth from 1980 to 2000 averaged 3 percent a year, whereas growth since the turn of the millennium is averaging 4 percent.
Clearly the most stunning development of the world economy over the past generation has to be China’s effective replacement of Japan in the global economic pecking order. Japan and the other early East Asian Tigers made up 12% of the world economy in 1991, a figure that has been falling steadily since then. China, which was only 2% of the world economy in the early 1980s had risen to 11% by 2008 and is likely to be one sixth of the world economy by 2015, on a purchasing power basis.
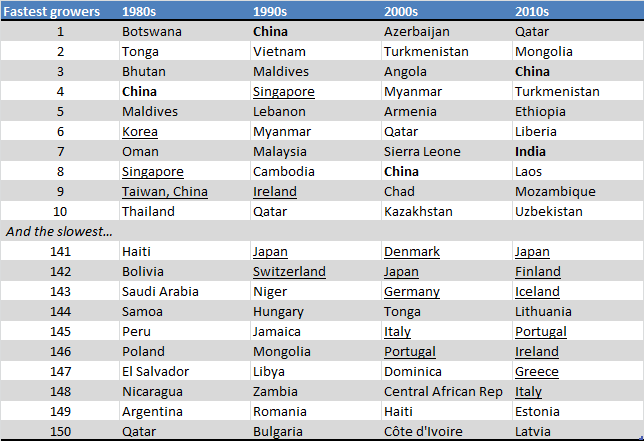
The table below shows the fastest growing economies in the world, across each of the four periods since 1980. For me, there are five take-aways, starting with China and India (both in bold):
- China’s high ranking in each decade is all the more remarkable when one sees that the majority of countries around it are either small economies, where a country-wide boom is by definition easier to achieve, or economies dependent on particular resources.
- Current growth suggests that India, which has not featured in the Top Ten until now, may emerge as the next China, a huge economy with consistently high economic growth.
- The 1980s and 1990s were the heyday of the small open economies, such as Singapore, Ireland and Taiwan, and their slightly larger counterparts in South-East Asia such as Thailand, Vietnam and Malaysia.
- The 2000s and 2010s appear to be the time of the resource-rich economy. It is very interesting to note how some countries that were cursed by their resources, such as Qatar (1980s) and Mongolia (1990s), are currently among the fastest growing economies in the world.
- Lastly, the countries that are part of the “high-income club” are underlined in the table (which it should be noted has been somewhat “cleansed” of conflict countries that are extreme outliers, so the ranking to 150 is indicative and not definitive). The high income countries are now dominating the wrong end of the table. For Portugal, Italy and Japan, there has been practically no economic growth since 2000. The worry is that they are now being joined by their peers such as Finland, Ireland and the Baltics.

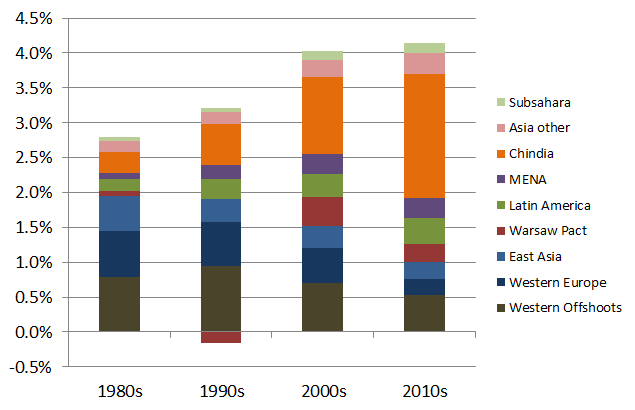
The fact that economies such as Finland, Ireland and Italy may be no bigger in 2015 than they were in 2007 is an extreme symptom of the shift in balance of power in the global economy. The chart below shows average annual economic growth worldwide, broken down into different regions. To reflect the starting point (i.e. not bias things by 2010s thinking) I have used Maddison-esque or 1980s terminology for my nine regions, so for example Western Offshoots means US, Canada, Australia and New Zealand, while Warsaw Pact means the former Soviet Union countries and Central & Eastern Europe.
The graph makes clear that global growth for 2008-2015 will not be a shadow of what was experienced in the Great Moderation. Rather at 4.1% a year on average, it will actually be higher than any of the other periods shown. If the world economy is a car, it is not changing gears, it is merely changing drivers. Rich countries no longer provide the bulk of economic growth. Whereas two thirds of the 2.8% annual growth seen in the 1980s came from the OECD and other high income countries, for the period 2008-2015 the figure will be less than one quarter of 4.1% growth.

Emerging Asia (i.e. outside of Japan, Korea and the other early Tigers) is now in the driving seat. Whereas China and India contributed just one tenth of all economic growth in the 1980s, that will increase to almost one half of all growth for the period 2008-2015. During these years, economic growth will average over 10% in China and India, and will average 6% in the rest of emerging Asia and in sub-Saharan Africa. Other developing countries will see growth of about 4%, while the richest countries will see their growth slow from 2-3% to 1-2% on average.
The world economy is currently experiencing not just the acceleration of growth in the East but the deceleration of growth in the West. While this is not set in stone, its implications for Western economies are stark in a business-as-usual scenario. High-income countries will certainly remain large in an absolute sense, but for companies and countries fighting solely there, it will feel more and more like a zero-sum game. This will be in sharp contrast to the sense of opportunity and frontier that will exist in emerging and developing countries, which will soon account for half of the world’s economy.
Shane ,
Hi Ronan,
In your opinion do you think Mongolias small population (2.4m i think) and its extremely inhospitable climate could limit its future growth and prosperity?
Thanks
Shane
Ronan Lyons ,
Hi Shane,
I was in Mongolia a few years ago as it happens and I think they’ve enough natural resources (particularly minerals) and perhaps the lowest labour-land ratio on the planet. Canada does very well despite having a very low labour-land ratio (which all else equal tends to drive up wages) and an inhospitable climate. Mongolia is landlocked, though, which reduces international trade, and leaves the country dependent to some extent on Russia and China (hence their recent closer links with the US and push for inward investment).
I think there’s more than enough potential in there for a generation-long boom in Mongolia. Whether that happens is of course an entirely different matter.
Thanks for the comment,
Ronan.
Gregory Connor ,
It would be interesting to see the same type of global-growth decomposition done using per-capita income growth instead of total income growth. With that type of metric, Germany, with a moderate total income growth rate and negative population growth rate forecast would contribute positively, but a developing country with high total income growth but even higher forecast population growth would contribute negatively. It should be feasible to do this, since population growth rate forecasts tend to be good over fairly long horizons; it would require a change in your metric. The analysis you have provided is interesting, but using per-capita income growth (and appropriately adjusting the algebra) might give a different message about which countries are contributing relatively strongly to the growth in global per-capita income.
Ronan Lyons ,
Hi Gregory,
Thanks for that comment. You’re right, I imagine the per capita figures would look a good bit different, especially conclusions about sub-Saharan Africa and indeed Germany, as you point out. Part of the emphasis above was about “size of the pie” type arguments, i.e. total world GDP and where that’s growing. A per capita exercise would probably have different implications but is no less useful an exercise.
R
Growth. Huh. What is it good for? Absolute poverty | The News On Time ,
[…] the same period, the global economy has more than trebled. So, does growth explain the improvement in life expectancy? According to UNDP data, Chinese GNI […]
Growth. Huh. What is it good for? Absolute poverty - Created by admin - In category: World - Tagged with: - The News On Time - Minute by minutes following worldwide news… ,
[…] the same period, the global economy has more than trebled. So, does growth explain the improvement in life expectancy? According to UNDP data, Chinese GNI […]
Growth. Huh. What is it good for? Absolute poverty - Ethiopian Clean Power - Mebrat ,
[…] the same period, the global economy has more than trebled. So, does growth explain the improvement in life expectancy? According to UNDP data, Chinese GNI […]