The companion post to this one discussed the different issues around measuring who pays what in tax in Ireland. It also asks you to give your own thoughts (free from the constraints of the data!), so if you haven’t yet read it, please do before reading on.
—
The post from 2009 outlined how the typical earner in Ireland in 2007 paid just 4% of their earnings over in income tax. Coupled with other information, primarily from the OECD on all-in tax rates for average earners, it painted clear picture of just how messed up Ireland’s income tax system was at the end of the bubble. Very generous tax credits, plus other reliefs, meant that most people had high marginal rates but low actual rates of tax: people thought they were paying a lot in tax while in fact they weren’t.
But, as discussed earlier, income tax is just one of the unavoidable blanket taxes, along with VAT, PRSI and the USC. Also, things have changed considerably since 2007, not only incomes but also the taxation system. What does the picture look like now, taking into account other forms of taxation?

Who earns what?
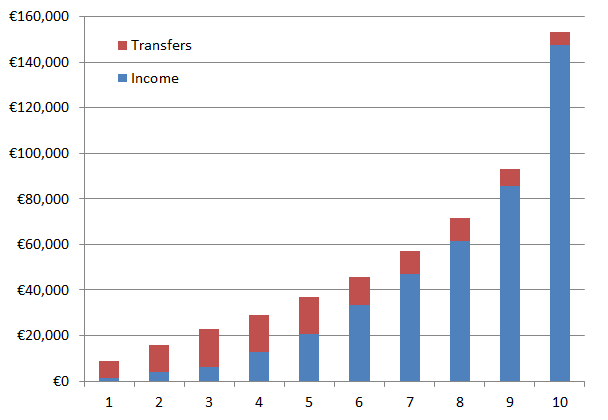
First things first, we need to set out what household we are looking at. The graph above outlines the ten stylised households analysed in this post – their incomes are taken from the CSO Household Budget Survey. (Remember – when looking at all these stats – that “household” here refers to all types of households, from students and OAPs living on their own to the nuclear family.)
The typical household in the poorest decile (10% of the population) earns just €1,400 a year and is given a further €7,400 in benefits. This is approximately the same level of benefits given to the second wealthiest 10% of the population. It is less than half the amount of benefits enjoyed by households in the 3rd-5th deciles (who earn annual incomes of €6,000-€20,000), who on average receive more than €16,000 a year in benefits.
The poorest 40% of households make ends meet by borrowing – in fact more than half of the €18,000 a year spent by the poorest 10% of households is financed by what economists call “dissaving”, i.e. either borrowing or running down savings. The richest 10% of households earn typically just under €150,000 and save almost €65,000 of that. In terms of inequality, the 90th percentile has almost 9 times the income of the 10th percentile and over 2.5 times the income of the middle household.
Who pays what?
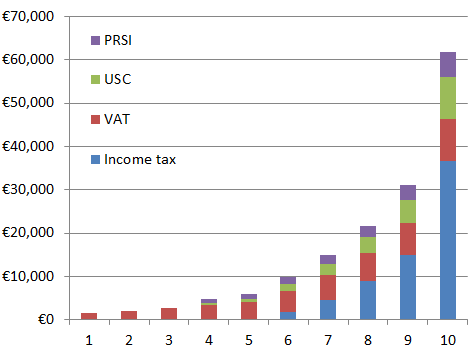
With that out of the way, we can look at what households actually pay in tax. The second graph shows the euro amounts paid in tax by each of the ten stylised households, from the typical household in the poorest 10%, which pays about €1,500 in VAT, to the typical household in the richest 10%, which pays just under €10,000 in VAT, the same again in USC, about €6,000 in USC and almost €37,000 in income tax. In the companion post, a poll question asked what readers thought the household earning the industrial wage paid in income tax, PRSI and USC: the answer is about 15%, although if the question had been income tax alone, the answer would have been just over 5%!

By these figures, the richest 10% of households pay almost 40% of all receipts from income tax, VAT, USC and PRSI. The second richest 10% pay a further 20%. Each of the poorest five deciles contributes less than 5% of all tax receipts – their combined contribution is just over 10%.
Simultaneously both excessively progressive and regressive
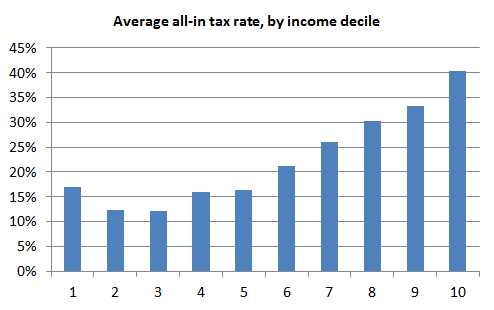
The third graph below shows the all-in tax rate (across income tax, USC, PRSI and VAT) for each of the ten income deciles. It takes into account earned income and transfers/benefits – which as I’ve stated before I believe should be treated as any other income source, to level the playing field between work and welfare.

The graph shows the quirks of the Irish system. The system is, with one important caveat, extremely progressive, with the tax rate on wealthiest households (40%) more than twice that on average households (16%). In fact, it is probably too progressive (at least the non-VAT elements), as the marginal rate on income above relatively low thresholds (when compared internationally) is 52%, above the mental barrier of 50% that resonates when foreign executives look at where to base their new operation.
But the system is also hugely regressive. Because poorer households have to spend all their income (and then some), and all that spending is liable for VAT, their effective tax rate surpasses all other income groups in the bottom half of the income distribution.
If a tax is simple and fair, it will be popular (or at least as accepted – when was a tax ever popular?!). The €100 household charge is simple but not fair. The current income and VAT regimes are neither fair nor simple – who here knows their “Widowed Parent 5th yr. after death” tax credit from their “Farmers’ flat-rate addition” rate of VAT? But with some clarity of thought from the Government, and perhaps a prod from Europe or the IMF, it is within our grasp to have fair and simple tax regimes.
A flat rate of VAT, perhaps 15% (the lowest permitted by the EU), would address much of the regressiveness of VAT. And a 15% flat rate of income tax, where all income is treated as taxable, even when it is gifted by the State rather than earned, would do much to address the other oddities of Ireland’s tax system.
Based on patterns of spending and saving, though, one concern might be that this new system as a whole would not be progressive enough. This suggests two simple tweaks to the flat income tax is needed, namely issuing tax credits for the first €10,000 of income and adding a second rate, e.g. a further 10% tax on all income above say €40,000.
Such a system would generate about 7% more income, and the effective tax rate of the poorest 10% of households would be reduced. (In this Ronan-dictator-for-a-day scenario, this new system would be brought in along with a Site Value Tax that would shift the burden away from economic recovery.) This system would also be significantly fairer, with effective tax rates varying from 15% (for the poorest decile) to 36% (for the richest decile).
Tweaking a broken system, however, is unlikely to get us back on the right path.
eamonn moran ,
“this new system would be brought in along with a Site Value Tax that would shift the burden away from economic recovery) but be significantly fairer, with effective tax rates varying from 20% to 30%.”
So you would be bringing the effective rate for the top Decile from 37% (including Vat) back to 30%?
But didn’t you say that this group was saving €65,000 per year already? Why do you want to transfer wealth to this group when they can already afford to save so much? Or did I pick that bit up wrong?
The Fact the government get back 35% of the welfare paid out to the bottom Decile is also amazing. When we say we give people 188 in weekly dole we rarely mention that the actual cost to the state is closer to €120 a week.
Sheila ,
Interesting, Ronan – can you clarify where you get your figures/calculations for actual tax paid for each of the sylised households?
Seamus Coffey ,
Hi Ronan,
Interesting piece. I would be surprised if someone in the lowest income decile paid €1,500 of VAT per annum.
To reach that around in 2011 they would have needed to spend nearly €8,650 on standard rated goods.
€1,500/.21 = €7,143 which + VAT = €8,643.
eamonn moran ,
Good spot Seamus.
So the lowest Decile pays 17% (still higher %rate than the 2,3,4 and 5th) And the cost of the €188 dole would not be about €120 but about €156.
Hi Ronan
You also say the hightest Decile earn about 155K save 65k and get taxed 62K. Does this mean they only spend 18k?
eamonn moran ,
sorry 28k?
Ronan Lyons ,
Hi Eamonn,
CSO figures indicate that the typical household in the top decile has a total income of €153,000 (of which €6,000 is in transfers). They pay €37,000 in income tax and a further €16,000 in PRSI/USC. They spend almost €90,000 a year but – as per the ESRI paper – their effective rate of VAT (relative to income) is just 6% so their VAT bill is €10,000.
Seamus,
CSO HBS figures indicate that the lowest-income households (which presumably include students/borrowers and pensioners/dissavers) are spending €18,000 a year, even though their income include transfers is just €9,000 a year. Their effective rate of VAT (relative to income) is 17%.
Sheila,
Have a read through the companion post (linked at the top) – figures are from the ESRI publication on the distributional effects of VAT, the Revenue Commissioners and the CSO Household Budget Survey.
Hope those comments help – thanks for the feedback,
Ronan.
Seamus Coffey ,
Hi Ronan,
That is very interesting. It seems that income statistics are not providing the full picture. I just had a look at the HBS as you suggested and the inequality in expenditure is far lower than the inequality in income. The composition of those in the lower deciles is very important.
An expenditure of twice income is quite a difference. That makes a mockery of the little bit of arithmetic I did above.
Where do they get the money? Savings, nixers, under-declaring income, family transfers etc. I’m off to do some reading. Interesting topic.
Dreaded_Estate ,
I put together a google doc using the revenue statistics on income distribution and the current taxes rates, not sure it is 100% perfect.
This allows you to see the effective tax rates and income that would be generated from different income tax structures.
https://docs.google.com/spreadsheet/ccc?key=0AutgOtkznKxIdE5uSjdrQVdXdHZzeGJrU1gtbzVmeWc#gid=1
Laura ,
Ronan
Would love to see the inclusion of mortgage interest relief in some of your figures. Surely this has an enormous impact on real incomes? I did a back of envelope calculation recently and figured out that over 7 years an upper rate tax payer could net 12k in this alone. Thats a lot.
One thing I’m curious about though is how the net figures are getting where they are. I pay 37% of my income in income tax and I am not on the top earning rates. Can anybody suggest a better tax advisor?
Laura ,
Ok I should have worded that better – I would suggest you look at what happens if you calculate net tax contributions with and without the impact of mortgage interest reliefs.
Three questions on an Irish debt deal | Eamon Ryan ,
[…] in April 2011 is following that plan and is on target to meet the objectives. As is shown here and here and here, there has been a radical increase in taxation in Ireland, which has been targeted first […]
David Carr ,
Could you just clarify the part where you mention the rate on income being above the 50% mental threshold .
From what you have illustrated the rate for the top tier is 40%, so why drop it to 36% given the state of the country’s finances. What benefit would it have.
Lies, damn lies and then Union funded statistics - Page 4 ,
[…] […]
Jack Sullivan ,
You say:
“But the system is also hugely regressive. Because poorer households have to spend all their income (and then some), and all that spending is liable for VAT, their effective tax rate surpasses all other income groups in the bottom half of the income distribution.”
This is not true. A large proportion of spending by poorer households is on food on which there is no VAT or other tax.