The first cut is the deepest – Dublin’s falls and Ireland’s property paradox
This week’s daft.ie report revealed some intriguing findings in relation to the current state and trajectory of Ireland’s property market. As was discussed yesterday, for example, while east peaked earlier than west, north has fallen further than south since the peak. One of the conclusions of both these findings is that Dublin and its commuter counties have experienced falling prices first and deepest.
This goes somewhat counter to conventional wisdom, although conventional wisdom hasn’t done too well in the last couple of years it must be said! Conventional wisdom would suggest that whatever about the Section 23 wastelands and ‘ghost estates’ of Ireland’s mid-West and elsewhere, the capital – as focal point for Ireland’s public and internationally trading sectors and their upstream and downstream employers – would be alright, at least in relative terms. In an Ireland where prices fell 20% in the crash, Dublin might be 15% or so while “somewhere else” would be worst hit.
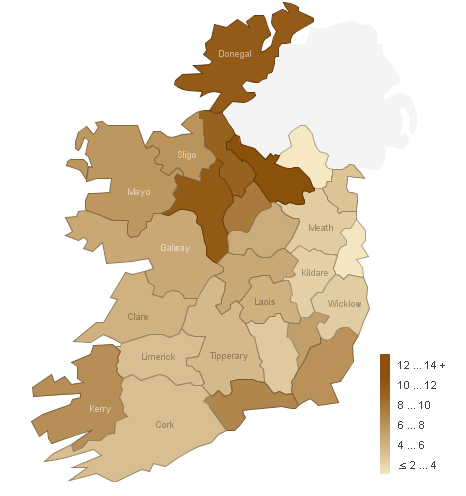
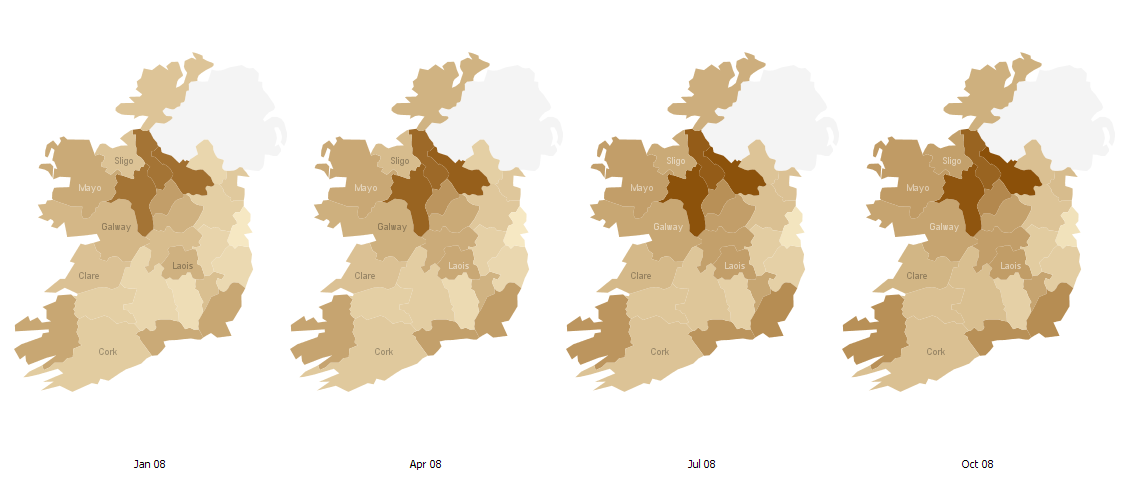
While easy to mock, there is something in this from a long-term perspective. I have argued before on this blog – in December and again in February – that the ‘overhang’ of property looks a lot worse, even with just approximate calculations, in the mid-West than in the capital or indeed any of Ireland’s five cities. With stock falling slightly in the last six months, no harm revisiting the ‘overhang per county’ chart again, with stock levels taken from today.

Again, the message is pretty clear – Cavan, Donegal, Leitrim and Roscommon have significant property ‘overhang’ compared to the likes of Monaghan, Kilkenny and Dublin and its commuter counties. The conclusion that I would draw is as follows: as it is home to the vast majority of Ireland’s top earners, to the extent that Dublin’s property market priced in expected future GDP and wage growth – i.e. confidence – it is to be expected that prices will fall most there, as confidence collapses from a high in late 2006 to a low in 2009. (The implication is that prices would be more likely to turn around faster, were confidence to somehow rematerialize.)
Taking a longer term perspective, though, unless prices adjust faster in places like Donegal, they face the prospect of longer peak-to-trough. Indeed already, some on theproperty.com are fretting about the future of places like Roscommon. On a thread entitled “Rents getting very cheap in the west“, mikewest’s message makes glum reading for property holders in Roscommon:
The house prices down here are still utterly crazy because something the developers never noticed is that there is shag all work in Co. Roscommon and if you dont have work then nobody wants to live there. People talk about the ghost estates in Longford and Leitrim but they don’t hold a candle to Roscommon. Every village and town has empty or virtually empty estates and / or apartment blocks…
There is another teeny tiny problem in the west. There are one or two houses too many in some towns right now so asking prices for rents are really more aspirational than actual but not quite as aspirational as asking prices for houses.
