Ronan Lyons | Personal Website

ronan lyons

Research Interests – an overview

My two main areas of research are economic history and economic geography. In other words, both time and location matter when we want to understand economic outcomes, such as why certain cities or countries have higher living standards or faster growth than others. My D.Phil. at Balliol College, Oxford, which was awarded in July 2014, was on the economics of Ireland’s property market bubble and crash. Much of my research focus follows on from this and therefore currently I am working mainly on housing markets.

One strand of my research attempts to understand the impact of various factors – in particular conditions in the credit market and in the planning system – on the housing market, both in terms of house prices and units built. This involves developing measures of both credit conditions and planning conditions in the Irish context, as well as understanding the many interrelationships between house prices and other factors.

With the help of the team at daft.ie, I am also involved in measuring household expectations in relation to the housing market. What we think will happen house prices over the coming number of years has a huge influence on whether or not we want to buy. But what do we think will happen? And what shapes those expectations? I hope to find out.

Another strand of research I am actively working on is extending our frame of reference for the Irish housing market back, beyond the current ‘start date’ of 1980 or thereabouts all the way back to the mid-1800s. The first wave of globalization – roughly speaking from the mid-1800s to 1914 – was full of features we think unique to our age, such as sophisticated international capital markets, rapid technological progress and political backlashes to international trade. Thus, extending our frame of reference back can teach us a lot about what makes the current system different and whether it is stable or not.

This ties in with other cliometric (i.e. quantitative economic history) research I’m involved with. Together with Richard Grossman and Kevin O’Rourke, I have constructed a monthly share price index for Irish equities, going back to 1825. This lays the foundations for a range of studies, comparing trends in Irish wealth to similar trends elsewhere and to internal Irish conditions.

A final strand of research that I’ll mention here is amenity valuation. It is often said that markets have little to do with public services, such as schools, prisons and landfill sites, and almost nothing to contribute on what are termed ‘non-market services’, such as a walk in the park or summer sunshine. This is far from true, however. We pay for access to these amenities in part through the rent or mortgage we pay each month. I am analysing the relationship between house prices and a range of amenities, including proximity to schools, rail and road infrastructure, flood risk, and green space. A better understanding of the benefit these amenities give allows us to spend public moneys better.

A list of publications, working papers and projects is available here.
Irish house prices fall 4% since the start of 2009 – latest daft.ie report

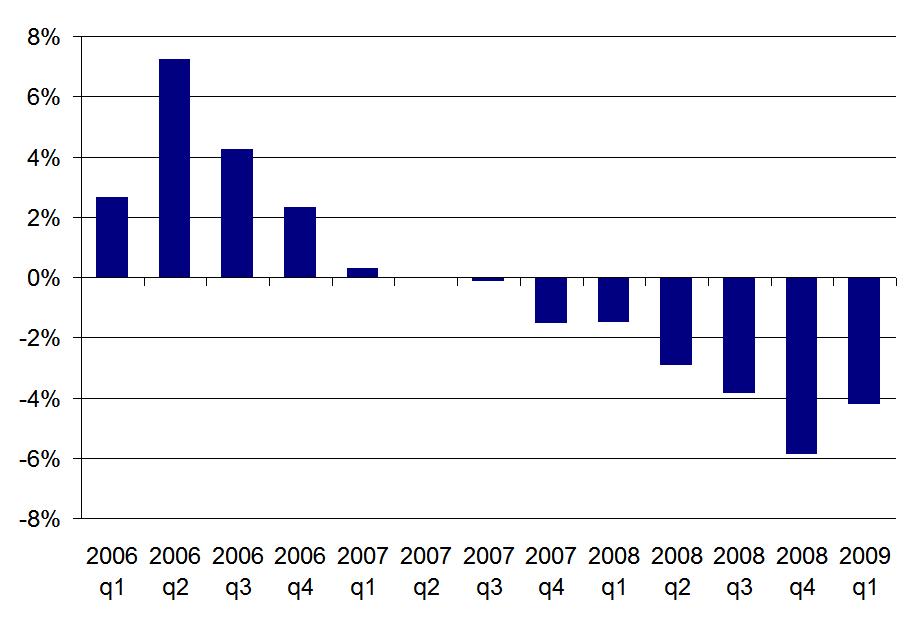
Ireland’s property slump marked it second birthday today, with the news from the latest daft.ie report that asking prices for residential property fell 4.2% in the first three months of 2009. This latest drop in prices marks the eight consecutive quarter that prices have fallen.

As the official press release notes, the national average asking price now stands at just over €280,000, meaning that prices have fallen almost €70,000 from the peak in early 2007. What’s interesting to note at this stage is that Dublin was worse hit on average over the first quarter – in particular Dublin city centre, where prices fell by 11%. Other notable falls since the start of the year are Sligo and Waterford city, where prices fell by about 10% in three months.

The fall in the first three months of the year should not be underestimated, particularly as the year-on-year rate of change has now slid to -15.7%. Nonetheless, a graph of the quarterly change in asking prices gives some food for thought. The falls in house prices got worse and worse more or less every quarter from mid-2007 on – until now, as the diagram below shows. How much we can read into this, though, will have to wait until next quarter, when we can see if the trend continues.

Change in national average asking price from quarter before, source: daft.ie

Commentator for this report is Liam Delaney, a behavioural economics expert. He discusses the importance of psychology – and the value in terms of self-worth of things like owning a house or having a job – in current economic conditions. He draws an important distinction between public and private sector workers (or at least that’s how I interpret it):

This report – combined with the recent labour force figures – indicates considerable hardship for those in once solid middle-class jobs that are now facing a potential double-whammy. People will inevitably feel even worse when they see neighbours and friends who are in better situations. Consider the position of a college graduate who purchased in Dublin in 2006, based on the income from his financial services job (now gone), to the position of his neighbour who secured a public sector position on leaving college and purchased in 2001. While neither is laughing, the latter must at least be considering himself the better off of the two. They are certainly not in the same boat and the widening rift in society being generated by asset price decline and employment uncertainty is the defining theme of our time. As described by John Fitzgerald and others, there are many who are currently better off than last year, as they are facing declining prices and interest rates in the context of stable employment in their sector.

He also describes two scenarios for the future, drawing on Gerard O’Neill‘s own commentary on a previous Daft report, where he suggested that the current economic maelstrom in which Ireland finds itself is probably the only thing that could possibly ever turn Ireland into a nation of renters – the implication being that may just happen. Liam then walks through the implications of these two scenarios:

One version of a national narrative that was articulated in the previous commentary by Gerard O’Neill was the idea that the Irish cultural and psychological need for property may be displaced by a culture where renting is given more credence as part of a normal adult life. Were such a story about the Irish relation to property to take hold, it would clearly have substantial implications for any potential future rebound in property prices. Key players at the moment are those who can afford property but are riding out the current uncertainty by taking advantage of falling rents. If they follow Gerard’s story, they may never come back into the buying market and the next generation may follow them into long term renting.

Yet, we still hear strongly the story that the Irish have always been and will always be wedded to the idea of home ownership as a fundamental part of maturing into adulthood. If such a story about Irishness and adulthood maintains its hold, house prices will eventually settle at a higher level, and changes in the market will depend on macroeconomic conditions, rather than on the type of seismic shift in Irish culture described by Gerard.

I’ll be posting each day this week on different findings from the latest figures, starting tomorrow with a Budget-day special… did someone say an Irish property tax? Later in the week, I’ll also look at the stock of property for sale – which incidentally has now fallen, however slightly, each of the last six months – but before I do, a quick comment on asking prices versus closing prices. Accurate measurement of house prices is a hot topic at the moment – it seems the ptsb closing price index reached a minimum fall in year-on-year terms of 10%, while asking prices haven’t yet found their nadir.

Changes in asking and closing prices, 2007-2009

The full report is available at www.daft.ie/report and contains, as mentioned above, a commentary by Liam Delaney, Lecturer in Economics with the Geary Institute, UCD, as well a regional and county-by-county analysis of the latest trends in the property market.

Public Sector pay in Ireland & the €50,000 question: It’s not that difficult!

Watching Monday’s Questions & Answers, I became increasingly baffled as to how poorly understood the gap between public sector and private sector pay in Ireland actually is. I conducted a mini-straw poll, through the various media of living room chat, email and Twitter. That poll made me realise that while I had been labouring under the presumption that despite all the stats we have on wages across sectors, those stats were having no impact, others were labouring under the presumption that the debate had to be kept at a general level because we had no statistics on the topic.

The guts of a decade ago, I undertook some research for Prof. Frances Ruane on the original benchmarking deal. What we found at the time was that there was no gap emerging between public and private sector wages, or if the gap was there at all, it was in favour of public servants. For those interested in more on that 2001 perspective, I’ve embedded a version from Scribd at the very bottom of the post.

Given the way this week is going, with public sector unions somewhere between agog and apoplectic at the idea of having their wages reduced, and given that no-one in public discourse (if Q&A is representative) is quoting these figures, I thought it might be no harm to see if I could do up what we in the business call “a one-slider” that might make them understand the decision a little better.

First, a general comment about public sector pay cuts. This can’t possibly be that much of a surprise to anyone in the public sector. After all, this is what they signed up to in 2001, with benchmarking. Benchmarking may have been an incredibly expensive way to do it – costing the economy €1bn+ every year and counting – but it did establish a principle in public sector wages in Ireland. That principle is that trends in public sector wages must mirror those in the private sector. It’s incredibly cheeky of those happy to have the principle applied in the good times to argue that they shouldn’t have to ‘bear the brunt’ of having the same principle applied in the bad times.

Now for the one-slider!

Graph of public and private sector wages, Ireland, 1998-2008

And in true consultant style, three key points from the above graph:

  • Lest we forget the most obvious, in every year of the series, public sector workers were paid more per year than their private sector counterparts*. 30% more on average! (There may be perfectly legitimate reasons for this, for example average experience/years worked may be higher, responsibilities may be greater… but a priori, who knows?)
  • As you can see, the gap has widened, not narrowed over the decade. In fact, in euro terms, it widened 8 years out of 10! And after the two years of greater private sector increases (prizes for eyesight if you can spot them on the graph), there were huge increases in public sector pay the following year.
  • Public sector pay is at least five years ahead of private sector pay. What public servants earned in 2003 took their private sector counterparts until 2008 to earn (in fact, they’re not even there yet, another €500 or so to go!).

With the Live Register now rocketing towards 400,000 and private sector wages now stagnant, bonuses disappearing, total earnings in the private sector are falling. Therefore, according to the principle of benchmarking, so must public sector wages. As they are paid €50,000 on average, compared to average wages of less than €38,000 in the private sector, this won’t be the biggest economic calamity to befall Ireland this year. Now, can we please incorporate this knowledge into our social dialogue?

[scribd id=11635058 key=key-2809dv8hrkl94xxmtc5r]

* Public sector includes public administration and education, but excludes health. No data there for some reason. Private sector includes all sector apart from agriculture (again no data). Some other methodological notes: I have had to assume Q4 figures for 2008 equal to Q3 in some instances or just take the average for the first three quarters, as Q4 data are not yet out. Construction figures only start in 2004, while manufacturing/industrial wages end in 2007, so I have had to use rates of change for the remaining sectors in those time periods, but the level of wages is determined by the full sample of private non-agricultural wages.