We’re different, roysh? The decoupling of the Dublin property market
Today sees the launch of the fiftieth Daft Report, with a commentary by yours truly. To mark the occasion, and to mark five years of Ireland’s property market crash, Daft.ie and the All-Island Research Observatory at NUI Maynooth, have launched a property value heatmap tool. In a companion post to this one, I outline the tool, how it works and what it tells us about Ireland’s property market crash.
In this post, though, I’d like to highlight what’s in the report itself. The principal finding from Q2 was that conditions in the Dublin market do indeed look to have improved considerably since the start of the year. This has happened at a time when conditions elsewhere in the country are pretty much unchanged. It seems the decoupling of the Dublin property market from the rest of the country has already begun.
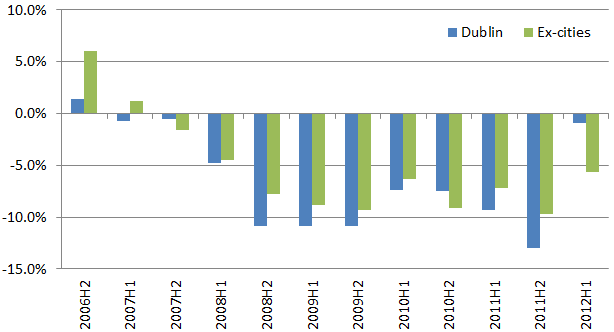
One reason for thinking this is price trends. While the average asking price in the capital did fall in Q2 (by 1.2%), taking the first half of the year as a whole, list prices in Dublin fell by less than 1%, compared with a fall of 10% in the second half of 2011. This is also in contrast to what is happening in rural Munster, Connacht & Ulster, where prices fell by roughly the same January-June as they did in July-December (7% vs. 8%). The graph below shows the six-month change in asking prices since 2006 for Dublin and for the “Ex-cities” category.

As I will tell anyone who’ll listen, though, recovery in the property market is less about prices and more about activity. We should not worry about house prices being low in Ireland – that’s good for competitiveness and mobility. We should worry about the number of transactions being too low. With barely 6,000 first-time buyer mortgages given out last year, in a country that is probably forming 30,000 new households a year, I think it’s safe to say transaction volumes in the Irish property market are unhealthily low.
There are two measures of activity included in the Daft Report, the stock sitting on the market over time, and – since January – the percentage of properties selling within a certain period of time. At less than 5,000, the total number of properties for sale in Dublin has fallen 35% from its peak. There are now fewer properties for sale in Dublin than at any time since the first half of 2007. By contrast, in Munster, there are 19,000 properties for sale, down only 12% from the peak stock on the market (21,000) and more than twice the early 2007 level.
The second figure below shows the proportion of households actively for sale at the moment – this doesn’t include vacant properties not listed for sale. Nationwide, the percentage has roughly fallen from 4% to 3% – but the spatial variation is revealing. About 1% of Dublin homes are for sale at the moment, compared to more than 5% in Munster, Connacht & Ulster.

But of course, the number of homes on the market is what might be termed endogenous. If prices stabilise or, wait for it, even rise in Dublin, there may be plenty of households holding back that will be tempted on to the market. So stock for sale is not without its limitations.
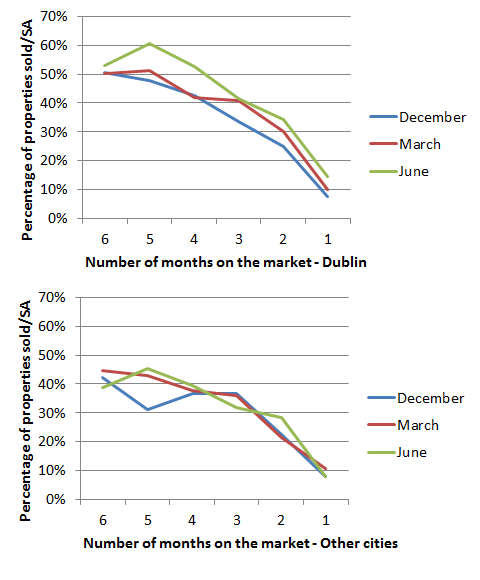
For me, the newest statistic in the Daft Report, the proportion of properties selling within a given number of months, is very interesting. It takes a bit of concentration to get the chart, when first presented with it – but the short version is, for property market recovery, one would want to see the lines rising over time. (Rising lines indicate that a greater proportion of properties are selling sooner.)
The graph below shows the proportion of properties selling within six months for Dublin and for Ireland’s four other cities as a group, at three points in time: last December, last March, and June. The proportion of properties selling within two months in the capital has risen from 25% last December to 34% now. Half of all properties listed in Dublin are sold within four months now, compared to six months late last year.

I haven’t really discussed Ireland’s other cities in this post, so let me do that now – their level of transactions are shown in the bottom half of the graph above. Interestingly, conditions are – on average – noticeably tougher, with more than half of all properties still unsold after not just six months, but a year. Still, with 40% of properties selling in four months, there is reasonable movement in those markets. In Munster, Connacht and Ulster (ex-cities), just 25% of properties sell with four months currently, the same proportion as late last year.
All these signs from Dublin may of course be a dead cat bounce, a false rally that brings out some of the latent supply on to the market, which – coupled with declining after-tax income and net emigration – pushes prices in the capital further down. However, Dublin prices are now down close to 60% from the peak, which when compared with incomes or more importantly rents, does seem close to “long-term economic value”. All thoughts, as ever, welcome.