Ronan Lyons | Personal Website

galway

Housing and Ireland’s competitiveness jigsaw

Housing should always be primarily a social issue. If the country cannot house its own citizens, this should be disturbing enough for remedial action. However, most people would acknowledge that, with everything the last five years have revealed, when housing is only an issue of social justice, it doesn’t feature high enough on the agenda. What needed to happen was for housing to become an issue of international competitiveness. Unfortunately, this has now happened – but fortunately, this means that it is far more likely to feature on the radar of key Ministers, policymakers and the Cabinet.

Housing has traditionally been regarded as domestic issue. Just as firms based in Britain typically ignored EU bashing in the media, as they didn’t want to meddle in a local issue, so firms based in Ireland typically focused on more obvious inputs to competitiveness, such as corporate tax rates and membership of the European single market. No firm wants to get a reputation for meddling in domestic affairs. However, firms based in both countries have realised that ignoring a political issue can be precisely the worst course of action. In the UK, firms are now scrambling to respond to the referendum result on EU membership last year. The powerhouse of the entire British economy – the hub of financial services centred in the City of London – could have its foundations taken away in coming years.

And in Ireland, large employers here have become increasingly noisy on the issue of accommodation. To see why, you need look no further than the National Competitiveness Council’s ‘Cost of Doing Business’ profiles. The standard FDI project coming to Ireland now is a services, or perhaps R&D, facility and for such projects, labour costs make up three quarters of their overall costs. This is a sea change from the 1980s and 1990s, when the IDA’s main targets were large manufacturing facilities, where half of all costs were imported inputs.

And the single most important item of spending is housing, which typically makes up one third of disposable income in cities. So of the three quarters that relates to wages, one third is down to housing. This means, simply put, that housing is one quarter of Ireland’s competitiveness. Therefore, when rental prices in Dublin rise by 65% in less than six years – or sale prices rise by almost 50% in less than five years – this does not just put pressure on those on lower incomes. It also erodes a key source of wealth for this country: jobs serving foreign customers.

When Irish-based subsidiaries of foreign-owned firms have to take unusual steps, such as offering bonuses to existing employees to temporarily house new ones, while they find their own homes, it is only a matter of time before HQ finds out that Ireland has a problem. In a world where capital is chasing skilled labour, and where skilled labour wants to enjoy all the amenities offered by a vibrant city, it is the cities that can house growth which will win. Irish cities are hopeless at accommodating growth currently. Dublin has now been allowed to grow up and so, since the 1980s, has started to sprawl. Commuting, though, is consistently ranked as people’s least favourite use of time and is not a viable long-term way of life.

But it is not just Dublin that is suffering. Cork and Galway are home to very large employers, with thousands of workers, in particular in pharmaceuticals in Cork and in medical devices in Galway. But both cities are struggling to accommodate the growth. One home was completed in Galway City Council in May last year… and while this is an extreme example, only 52 new homes were started in the city in 2016. In a rapidly growing city of 80,000 people, it should be adding closer to 800 a year – over 15 times the current level of activity. In Cork, just 310 new homes were started. In a city with a population of 200,000 people, it should be adding 2,000 new homes per annum.

And the problem is not limited simply to the building of homes, although it is clearly at the heart of the issues. Access to schooling, childcare, public transport and infrastructure are all related to the decision of where to live and work. Back in Galway, traffic has become such an issue that there are stories of three-hour commutes after work from the east of the city, where most of the business parks are, to the west of city, where much of the housing is. Three hours to cover ten kilometres is not sustainable.

Housing is and always will be first and foremost an issue of human rights. In a modern, high-income country, access to housing should be guaranteed by a system of subsidies that top up a family’s means to meet their need, where appropriate. But housing is also a competitiveness issue. If we don’t figure out how to build enough homes quickly, it will start costing the country jobs.

Two charts on the stock of property for sale in Ireland

Has the new year brought a change in the property market headwinds? Will first-time buyers waiting in the wings find themselves missing out if they don’t move soon? This post looks at trends in the total stock sitting on the market in both apartments and houses, across Dublin, in the other major cities and in the rest of the country. It also estimates the percentage of all properties currently listed for sale in each segment Read more

How many Irish homes are in negative equity?

Ireland’s property market is currently in rewind. Homes now are at March 2005 values – or July 2004, if asking prices are 10% above closing prices. Figures from daft.ie, the Census and the Dept of the Environment allow an estimate of both the number of homes now worth less than when they were bought – about 725,000, or 40% of homes – and how many of those are in negative equity -about 340,000, or 20% of homes. Read more

Lopping the top half off & Ireland’s property market in a global perspective

On Monday the latest daft.ie report came out, showing that asking prices had fallen just over 4% in the first three months of the year. Yesterday, I changed focus on the blog a little, as it was Budget day, and tried instead  to put some numbers on what a potential property tax could raise.

Today, I hope to give a little more detail on the findings from the report itself, in particular regional trends, and then give an international perspective also – or at least start to give one, which I think is always instructive. Below is a graph showing the quarter-on-quarter change in asking prices for the last two quarters, i.e. Q4 2008 and Q1 2009, in each county.  The most obvious finding – probably not a surprise to anyone – is that asking prices fell in almost all counties in both quarters. A second clear finding is that there does not appear to have been one or two counties more affected in the last six months than elsewhere (although one could make the argument that Munster has got off relatively unscathed since September).

Quarter-on-quarter changes in house prices, 2008q4-2008q1

What also jumps out is that the two quarters saw very different patterns. In the final three months of 2008, a few counties – such as Galway, Westmeath and to a lesser extent Donegal and Leitrim – saw the largest downward adjustments in asking prices. Two counties, Mayo and Tipperary actually saw no fall in their asking prices. This quarter, Mayo and Tipperary actually had slightly larger falls than average – perhaps a sign that sellers there had been holding for the start of the year before acceding to the realities of the market. On the flip side, sellers in Galway and Westmeath believed in Q1 that their large adjustments in late 2008 did not need to be followed up with more adjustments straight away.

Sligo has been the worst hit county in terms of falling house prices, with a fall in the region of 10%in three months alone. (Dublin city centre and Waterford city actually saw bigger falls but they are lessened by other parts of their counties.) Aside from that, it seems that Dublin generally and the counties around it were among those with larger adjustments since the start of the year.

This leads on to perhaps a more interesting question – how have counties fared since their property prices peaked? To do that, I’ve set up another Manyeyes dataset (which anyone can access) with the percentage gap between house prices in a given quarter and the peak, for each county. Where a county is sandy coloured, that means it has peaked. The deeper the blue, the bigger the fall. (One little trick with these figures is that for a county’s earlier “blues”, prices are still going up. By the second row, that’s no longer an issue.)

Change in asking prices from the peak, 2007-2009

A couple of findings emerge, based interestingly on alternate axes of the country:

  • East peaked before west, on average, and by almost six months. If you draw a line from Cavan down to Wexford, 10 of the 13 counties peaked in the first half of 2008, more than half the country in population terms, including all of Dublin and its offshoots. Cork, Galway, Limerick and a few other counties actually peaked in the second half of 2007, while a couple of stragglers – Tipperary and Westmeath to be precise – only peaked in early 2008. (Interesting to note, in passing, their sellers’ totally different reactions to conditions in late 2008, as per the first chart above.)
  • North is falling faster than south, on average. If you draw a line from Dublin over to Galway, 9 of the 10 worst affected counties so far come from that half of the island. The top half of the property market – literally! – has been lopped off more than the bottom half. This means that the north-east – essentially Dublin-plus – fell first and is falling hardest, while the south-west – Munster – was last to fall and has fallen least so far. It will be interesting to compare these emerging trends, two years into the property crash, with the final statistics on Ireland’s property readjustment/crash/Armageddon/return to sanity/fill in name here.

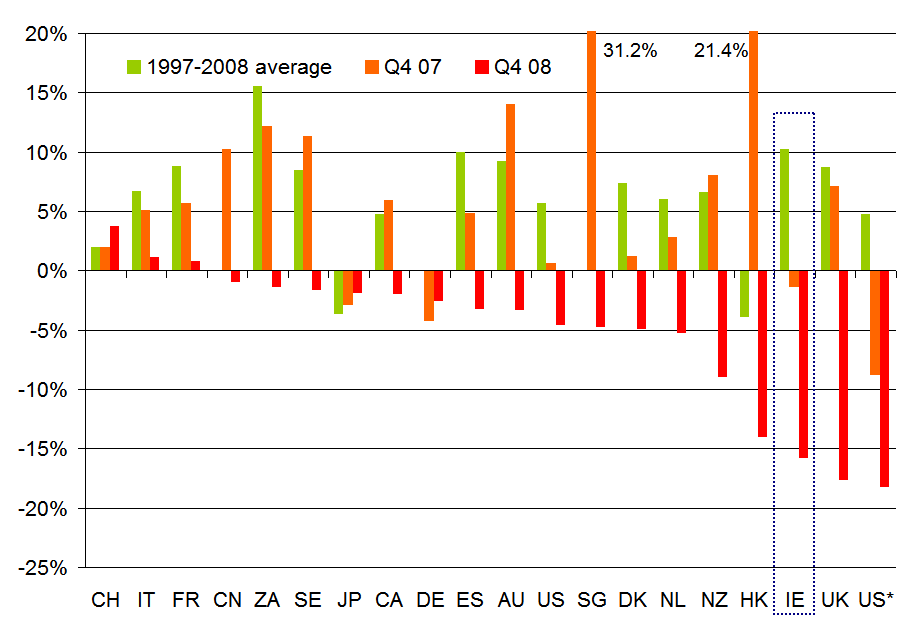
Speaking of writing the history books, perhaps it’s no harm to have a quick look to our left and our right and see how other property markets are faring. Below is a chart of about 20 countries (with two different measures in there for the US, the first is the OFHEO measure, while US* is the Case-Shiller national index). I’ve based this on data posted on the Economist’s website, but have surreptitiously replaced the 2007/2008 ESRI data, about which there is a lot of scepticism currently, with daft.ie data. The bars show the annual rate of change in house prices, including a 1997-2008 average, and figures for 2007 and 2008. (As per the Economist website, some of the Q4 08 figures are actually Q3 08 while a couple, including Ireland, are Q1 09.)

International comparison of property markets, 1997-2009

Replacing the ESRI data with the daft.ie had the effect of moving Ireland from the “Club of Moderates” such as Denmark and the Netherlands, to the “Bleeding Edge” group with Hong Kong, the UK and the US (at least one measure for the US at any rate). I will do my best to try and track down the original data for this series so that a change-from-peak measure can be contructed as again that may be more instructive than a year-on-year change, particularly in six months time.

In the meantime, though, I’ll leave this up here and ask for any insights, comments or queries, as per usual! Fire away…