Ronan Lyons | Personal Website

eurozone

Slow and steady: Ireland’s competitiveness, five years on

One of the mantras of Celtic Tiger Ireland was that it was a rip-off Republic. And indeed, by 2006, Ireland had overtaken Finland to become the most expensive place in the eurozone for consumer goods.

Mid-2008 marked a turning point, however, and the combination of global economic turmoil and local economic depression meant that prices fell for over 18 months from until early 2010. Regaining competitiveness with our currency peers does not necessarily involve deflation, however. It can instead be brought about by more moderate inflation in Ireland than in other parts of the eurozone.

And since 2010, that is what has been happening. The first graph below shows consumer price levels (as measured by HICP, which is designed to be comparable across EU member states) in four economic groupings. In addition to the eurozone core and Ireland, also shown are the PIGS countries (the “I” here refers to Italy) and the new EU member states (largely outside the Euro for the period shown).
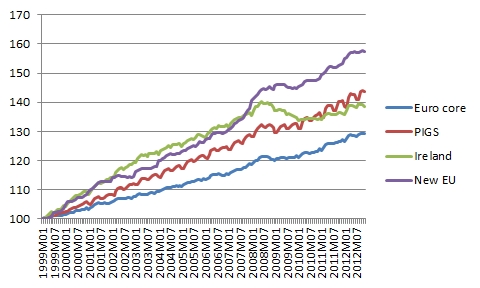
Consumer prices in selected EU regions, 1999-2012

In the first period, from 1999 to early 2004, Ireland acted like a new EU member state. Consumer prices increased by 22% in that period in Ireland, compared to 20% on average in the new EU states, 14% in the PIGS and 9% in the eurozone core. The second period, from early 2004 to mid-2008, Ireland actually saw more moderate growth in prices: 14%, in line with other PIGS (15%), below the new EU states (21%) but above the core (11%).

In the 50-odd months since August 2008, Ireland has been unique. Prices in Ireland have actually fallen by 1% in that period, while they have risen by almost 10% in both the PIGS and the new EU member states. In the Eurozone core, they have risen by 6% in the same period.

A direct comparison of Ireland and the eurozone core shows this competitive readjustment more clearly. The second graph below shows prices in Ireland relative to the eurozone core (=100) from 1999 on. Ireland’s price competitiveness worsened by 12 percentage points in that early period (up to 2003) and by another four percentage points (roughly) between then and 2008. In other words, it was the early years of the eurozone when the damage was done to Ireland’s cost competitiveness.
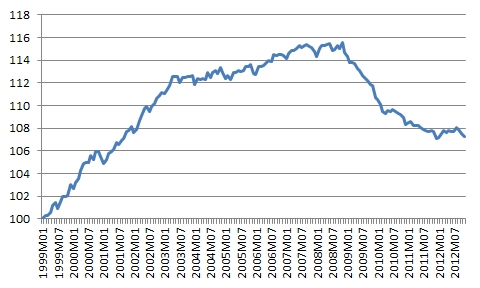
Prices in Ireland relative to Eurozone core (1999:1=100)

Of that 16-percentage point worsening in Ireland’s competitiveness, roughly half has since been eroded away. Compared to 1999, Ireland’s price levels have risen by 8 percentage points more than the Eurozone core. (This hides differences by particular categories of goods and services – a subtlety that matters a lot!)

In truth, that 8% figure probably overstates things slightly, as HICP excludes accommodation costs, which are the single biggest component of consumer expenditure.  Both rents and house prices in Ireland at currently at levels comparable to 2000, which is unlikely to be the case in any other European economy. Perhaps the only other candidate for such stable figures is Germany, but its property market has heated up the last two years, meaning costs are a good bit above 1999 levels.

In short, it has not been fun – as inflation is associated with expansion and deflation with contraction – but Ireland has put in five hard years of competitive readjustment. With prices on hold, so are wages, which boosts Ireland’s attractiveness for FDI. The sting in the tail is that with inflation throughout the eurozone so low, any further competitive gains are going to be even tougher and slower.

Can the eurozone survive? Insights from the dollar-zone

With its future and survival increasingly topics of discussion, this post looks at the eurozone and two key questions. Firstly, are the eurozone’s member states too different to share a currency? Secondly, if the euro is to survive, will it need tax harmonisation and a big increase in federal spending? It answers these questions by comparing the eurozone and its members to the U.S. economy and its States. Read more

Competitiveness regained? How prices in Ireland compare to the rest of the eurozone

Eurostat’s publication of prices of food and drink across Europe has highlighted again how expensive Ireland is relative to its neighbours. This post examines prices across Eurozone members since 2001 and finds that the damage was done in Ireland by 2003 – and that much has been reversed in the last two years. It’s unlikely, though, that Ireland will rank below third in price league tables any time soon. Read more

Untangling Europe’s “web of debt”

This post examines the so-called “web of debt” across the EU, a graphic published in a recent New York Times article. By using gross debt statistics, and regardless of the borrower’s sector, the chart misses the obvious point that the markets are worried primarily about government debt. Indeed, the logic of the chart forces the authors into almost the completely wrong conclusion about the UK! Read more

With commodity prices rising, inflationary pressures start to mount in the eurozone

Inflation in the eurozone has jumped up in recent months from -0.5% to +1.0%. This post examines the likely pressures on eurozone inflation in 2010, by looking at the prices of commodities. Using World Bank data on commodity prices, it finds rapid inflation in commodities since late 2009. With the current over-reliance of macroeconomic policy on interest rates, this poses a threat to eurozone growth. Read more

Taxpayers in Baltics, UK and Ireland facing the toughest questions

Two weeks ago, I examined the IMF’s estimates for growth prospects in 2009 and came to the conclusion that in a year where countries such as Afghanistan, Ethiopia and Laos are among the world’s fastest growing economies, more open economies are being hit by a collapse in the globalized consumer’s demand.

The temptation may be to regard this as a somewhat academic question but a closer examination of eurostat figures and the latest European Commission estimates for 2009-2010 shows why this has practical fiscal implications. Eurostat figures show that the EU’s budget deficit between 2000 and 2007 averaged just over 2%. Faster-growing countries such as Bulgaria, Estonia, Ireland and Sweden ran surpluses (Finland ran quite large surpluses in fact), while most of the Old Europe stalwarts, such as Germany, Italy and the UK, ran what would until recently have been termed sizeable budget deficits (i.e. greater than 2% on average).

The EU’s budget deficit grew from 0.8% in 2007 to 2.3% in 2008 and, according to the Commission, is set to almost treble this year to 6%. Next year, that deficit could increase even further to about 7% of EU GDP. Four countries face the prospect of their government balance undergoing a double-digit swing from what they were used to up to 2007 and what they will have to face in 2010 – Spain, the UK, Latvia and Ireland.

Given that foursome, I thought it might be worthwhile to see what groups there are within the EU – when it’s clear that the global trough has been reached, unanimity of purpose may pass, so these groups could have a political as well as economic relevance. The graph below shows mean budget deficits across seven relatively self-explanatory regions in the EU (GAF = Germany, Austria, France; PIGS = Portugal, Italy, Greece, Spain; CEE = Central & Eastern Europe). The regions are ordered from left to right by how ‘in balance’ the economies were from 2001 to 2007. What’s worth noting is that the ordering of the regions will have changed by next year – the Baltics and the British Isles (if I may call them that!) face significant budgetary deficits.

Budget deficits, 2001-2010, by EU region

With more open economies being harder hit, their governments are facing pressure from all fronts. Alarming statistics are still coming in from places like Latvia, where output is down 30%, and Ireland, where tax revenues are down 24%. If exporters are being hit, their workers are likely to be hit – and the longer the recession goes on, the more workers will hold their consumption in check (not to mention unemployment).

The problem is that government deficits are the last point in the cycle – increasing taxes may have to wait unless the government wants to be responsible for second-round effects. This leaves Ireland in quite a conundrum, as its 2001-2007 tax base will not be coming back any time soon.

Tackling the thorny issue of teachers pay

Earlier this year, I calculated average salary estimates for the public and private sectors in Ireland. The answer, that the average worker in the private sector earned €40,000 last year, almost €10,000 less than their public sector counterpart, has proved if not controversial than certainly a starting point for debate. Given some of the comments on that blog post, and the fact that the teachers conferences were being held last week, I decided to look in a little more depth at the education sector. How much do teachers in Ireland earn? How does this compare with other people in Ireland? How do teachers’ salaries in Ireland compare with other eurozone teachers?

Trade unions have been clear on one point since the size of Ireland’s fiscal crisis became clear: those most in a position to pay should bear the brunt. At the same time, teachers unions have said that their pay is not up for discussion. This implies that teachers presume that they are not among those most in a position to pay. How does that stack up with the stats? The chart below shows average earnings in mid-2007, the latest data across all sectors, with public sectors marked in dark blue, private sectors in light blue, and semi-state in mixed blue.

Salaries by sector in Ireland, 2007 (source: cso.ie)

The single most striking thing is that all the best paid sectors in Ireland are either public or semi-state industries. (Those looking for more detail might start with Dept of Education figures out last week showing that primary school teachers earn on average €57,000.) Surely, any objective trade union leader should be arguing that whatever burden workers have to bear, the bulk of it should be borne primarily by the public and semi-state sectors.

There are a few common queries people have with the relevance of these statistics. The first often runs: “Hang on, you’re not comparing like with like. All teachers have a degree, while who knows how many people do in, say, paper and printing.” Ideally, I’d like to have the stats to hand to explore this. Unfortunately I don’t. My only comment before we move on is that if finance and business services had come out as the best paid sectors in Ireland, would the same people have argued that we should wait and see whether their higher wages were justified by qualifications/experience/profit created? Or would people have argued that as they were best paid, they should pay most?

Let’s move on, though. If comparing education with other sectors in Ireland is not fair, let’s compare Irish teachers with their eurozone counterparts? After all, our old trick in situations like this was just to devalue and hope for the best. Now we share a currency with a dozen or so other countries. Are our teachers overpriced?

The graph below uses OECD statistics to examine teachers’ salaries across the eurozone. (I’ll take this chance to recommend the OECD’s Education at a Glance 2008: even if you hate absolutely everything I’m saying here, do take the opportunity to wander around its facts and figures.) In Ireland, a teacher in the job 15 years, single with no kids, earns more after tax than his or her counterparts do BEFORE they’ve been taxed in most other eurozone members. Marry that teacher off and give them two kids and – despite Germany’s best efforts to catch up – Irish teachers are by far the best paid of the ten eurozone countries shown.

Average salaries (gross and net) for teachers in the eurozone, 2007

OK, so Irish teachers are well paid relative to other Irish workers – they may just be better qualified. And yes, they’re paid substantially more than their eurozone counterparts. Perhaps price levels are so substantially higher in the rip-off republic that teachers in Ireland need this extra pay just to break even? Unfortunately, eurostat figures on comparative price levels don’t back that assertion up. Whereas prices in Ireland are indeed 15% higher than in France, the single teacher above enjoys 75% more take-home pay. In Finland, prices are just 2% below Irish prices, but an Irish teacher enjoys a wage that is 54% higher than a Finnish counterpart.

If prices don’t explain the international gap, maybe Irish teachers work a longer year than their eurozone counterparts, explaining why they get paid more. Unfortunately again for Irish teachers, the opposite seems to be the case, as the graph below shows. Teachers – particularly secondary school teachers – work less days on average than almost all their eurozone counterparts. This leaves the amount paid for every day spent teaching in Ireland looking pretty unsustainable. Factoring in the pension levy only scratches at the surface of the problem.

Days taught by teachers and earnings per day of teaching

Ireland is currently grappling with a huge fiscal and economic crisis. The government faces lots of tough choices about what stays and what must go. The fact that they’ve chosen to cut back some education services suggests that they are missing what should be obvious: the more we bring Irish teachers’ salaries back in line with counterparts elsewhere in the eurozone, as well as with other sectors in Ireland, the less we’ll have to cut back on the range of education services we offer.

As teachers of maths should appreciate, the arithmetic is simple. The government needs to make savings across the board in publicly-funded services, including education. To make savings in education, we can either cut back on education services (quantity) or cut back on teachers salaries (price). Teachers have so far been successful in passing those two issues off as one, and thus creating a somewhat bizarre alliance of service providers (teachers) and consumers (parents/children).

Given how Irish teachers’ pay compares domestically and internationally, it’s time we separated out teachers’ pay from education cutbacks and took a long cold look at what our teachers are paid.

The Humpty Dumpty threat: Will the euro fall apart?

Ricky Gervais has a very funny sketch about how ludicrous the children’s rhyme, Humpty Dumpty, is. In particular, employing horses, who don’t even have thumbs let alone opposable ones, to put him back together again. Actually, it’s so good, I’m going to embed it here:

[youtube=http://uk.youtube.com/watch?v=hYytaZ06Hco]

Anyway, spurious introduction aside, apparently according to the Financial Times (thank you irisheconomy.ie), the euro is in danger of becoming our very own Humpty Dumpty, thanks in no small part to the risks associated with Ireland (as well as Spain and Greece). The video is well worth a watch for the spreads he shows emerging for the triumvirate of risky eurozone members. He refers also to intrade prices of 30% for one country pulling out of the eurozone in the near future, which he rightly points out are amazing odds for what would seem to be such an extreme event.

And if that were to happen, would anything policymakers try to do in response to fix the euro as a viable reserve currency be just the equivalent of sending all the King’s horses to mend a broken egg? Interesting times…