Yesterday, former Minister for Finance Charlie McCreevy appeared before the Oireachtas banking enquiry. His refusal to answer whether or not he believed Ireland suffered a property bubble that burst in 2007 was not only great TV, it also brings up some important issues. For example, the Irish Independent reports:
The conflict arose when Mr Doherty asked the former minister if he believed there had been a property bubble in the previous 15 years before the financial crisis. Mr McCreevy insisted he would only answer for his time in office and there had been no property bubble during that time… [after legal advice] Mr McCreevy said from 2003 to 2007 house prices grew at an extraordinary rate. He supposed that was a bubble. But he said: “I don’t believe the policies I pursued helped to create that bubble.”
The clear implication is that Mr McCreevy believes that, if there was any housing bubble at all, its roots do not lie in decisions made in the period 1997-2004, and that in reality there was no bubble at all. Given the title of my doctorate at Oxford was called “The Economics of Ireland’s Housing Market Bubble”, you might not be surprised to learn that I disagree.
First, I think it is important to note that there are two ways of diagnosing bubbles. They can be thought of as statistical bubbles and economic bubbles. A statistical bubble is one where the growth rate in the price of an asset, such as housing, grows at a rate that is unsustainable for any reasonable period of time. Between 1995 and 2007, house prices in Dublin increased by 300% in real terms (i.e. stripping out inflation), or 12.2% a year. Between 1997 and 2004, McCreevy’s term in office, the increase was 136%, or 13.1% a year. (Nationwide figures are comparable, although slightly lower for the period as a whole, although not necessarily in every year.) Thus, by any statisticians metric, it was a bubble – put another way, if 12% growth had continued for 25 years, a house costing €100,000 in 1995 would have cost €1.7m by 2020.
Economists like to get at causes, though, and a 10% increase due to – for example – a lack of supply has very different implications for what policymakers should do than a 10% increase due solely to first-time buyers needing a smaller deposit and thus being lent more. To economists, a bubble in asset prices is not just any old increase in prices, it’s an increase in prices due to excess capital/money. In the housing market, this means too much mortgage credit. Of course, to sustain people borrowing and lending too much, you need expectations. So the two ingredients for an economic bubble are over-optimistic expectations and excessive credit.
The graph below is, in effect, the one-chart summary of one of my D.Phil. chapters: what drove real house prices in Ireland during different market cycles (measured in changes per annum). Falling income (measure here relative to supply), pushed down house prices in the 1980s, together with higher real interest rates (a term that includes house price expectations). This reversed somewhat during the period 1987-1995, which income, as well as demographics (fewer people per household) pushing up prices by nearly 5% a year. Note, however, that credit conditions – measured by the ratio of mortgage credit to deposits – were not pushing up house prices as this time.
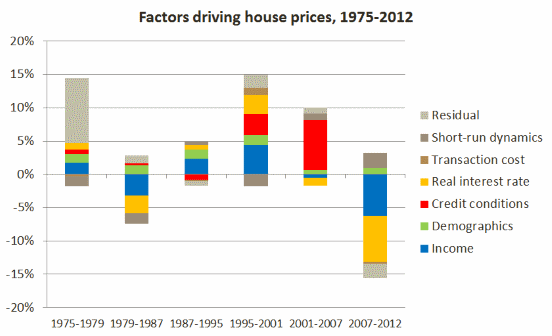
The period 1995-2001 saw very strong house price growth, driven by a combination of tailwinds, including incomes growing proportionately faster than housing supply. By the time these supply constraints were removed – through the follow-up to the Bacon reports and other measures – borrowers and lenders now expected rapid house price growth. These unrealistic expectations were facilitated by rapidly easing credit conditions. Crucially, almost all house price growth from 2001 to 2007 was driven by a relaxing of credit conditions.
What this means for Mr McCreevy is that it is simply not credible for him say that there was no housing bubble on his watch. Bubbles, driven by asset factors in particular expectations and credit, grow out of booms, when demand outstrips supply. The 1995-2001 boom created the 2001-2007 bubble. A Minister for Finance in 2004 could have tried to burst the bubble, but not prevent it. To do that, the Central Bank mortgage rules would have had to have come in not in the mid-2010s but in the late 1990s.
—
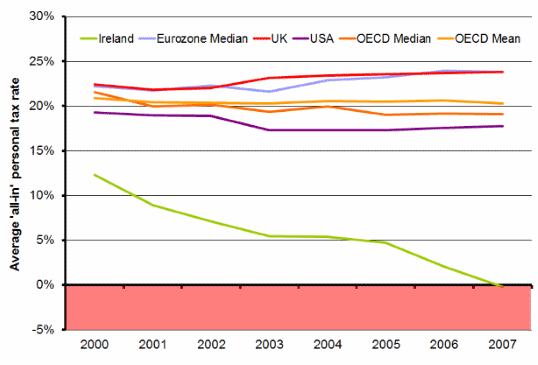
A post-script. Mr McCreevy has come to be known as a man who strongly believes in pro-cyclical fiscal policy. As he clarified yesterday, as Minister, he believed “When you have it, you spend it.” Exhibit B below is a graph I show my first-year Economics students. It is the average all-in tax rate paid by a household on an average income, by country and year from 2000 to 2007 (source: OECD). At a time when the Irish economy was growing more rapidly than ever before, the state took a declining share of these higher incomes. I think a strong case can be made that much of the austerity undertaken by Ireland in the period since 2007 would not have been necessary if tax rates had been in line with other developed countries and that Ireland sorely missed a Minister for Finance able to spot that Irish fiscal policy was increasingly unsustainable and take the steps necessary to correct the path.
Josh Vinegar ,
Fascinating observations, gives me a lot to think about.
I wonder how similar or different the Canadian economy at present matches some of what you’ve discovered.