As I mentioned in my earlier post today, Ireland has –at long long last – a public property price register. I also mentioned that it is a tricky business to extract any meaningful signals about the market as a whole from a database that has no structured information about location (other than county), never mind the property’s attributes, such as size, type, number of bedrooms, bathrooms, etc.
“Tricky” is not the same as “impossible”, though, so in this post, I’ve assembled a few facts and figures about the market, based on the 50,000 market-price transactions that have taken place since January 1 2010.
The IMF effect
The key use of the property price register, when talking about analysing the market as a whole, is the information it contains on the volume of transactions. The picture that emerges is a tale of two halves. The first half is the what happened in 2011 compared to 2010, the IMF effect as the economy in general and property market in particular adjusted to life in bail-out Ireland.
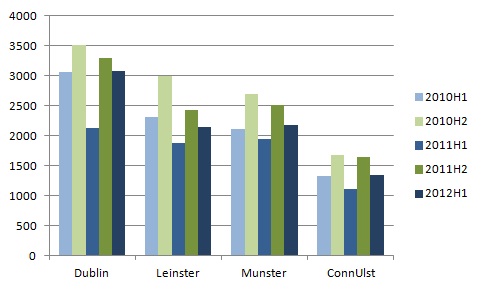
The impact on volumes was clear. The number of transactions in the first half of 2011, at just over 7,000, was 20% lower than the same period in 2010, when it was just over 8,800. Dublin in particular was hard hit by the uncertainty, with the number of transactions down 31%, from 3,100 to 2,100.
The first half of 2012 has been a period of regaining lost ground, with the total for the six months to June 2012 of 8,740 very close to the 8,800 two years previously. Dublin has been driving the higher volume of transactions, with over half of the extra 1,700 transactions occurring in the capital, but in general the increases in 2012 just offset the losses of 2011.
An overview of the volume of transactions by broad region is shown in the graph below.

A first look at prices
Using a property price register to say anything at all about what has happened prices in the market as a whole is a game fraught with dangers. The most solid statistic is the median (or typical) price, i.e. the one with as many transactions cheaper than it as more expensive. It is quite different to the mean (or average) price, which will be skewed if one property sells for €100m, compared to €10m.
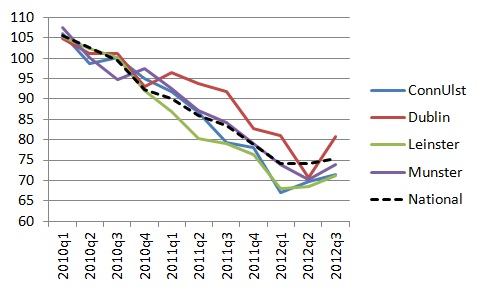
The picture that emerges is one probably far removed from the expectations of conspiratorial types who believed that everyone from the CSO to myself was involved in over-stating (or fabricating) a recovery in the property market. If anything, recent reports have understated the extent to which prices have stabilised. The first graph below shows the median price per region per quarter. The stability since the start of the year is notable, particularly when contrasted with free-falling prices in 2011. Also notable – with the exception of Q2 2012 – is the much smaller rate of decline in prices in Dublin than in other regions of the country. Since 2010, prices are down 20% in Dublin but 30% elsewhere.

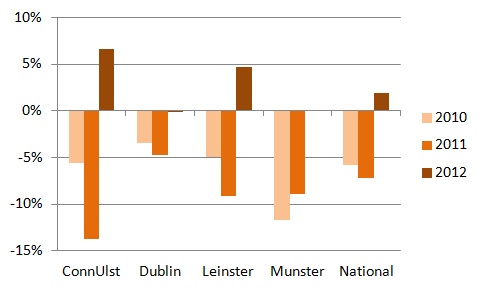
The second graph below condenses this change in conditions since the start of the year. It shows the percentage change in median price between Q3 and Q1, for 2010, 2011 and 2012. Conditions worsened in 2011, with the national median price falling 7% between Q1 and Q3 2011, compared to 6% 12 months previously. By contrast, median prices have risen by 2% between Q1 and Q3 2012. Do not adjust your sets: yes, I wrote “prices have risen”!

What next?
Suspicious types should be asking themselves why I chose the rate of change between Q1 and Q3, rather than the more obvious Q2 to Q3. Using Q2 instead would suggest a 14% increase in Dublin prices in just three months. Would anyone believe me if I said that?
That highlights the limitations to using the property price register for any sort of price analysis, even the (hopefully) careful median price analysis I’ve done above. The reason why a median price might shift 14% in just three months relates to the limitations of the data: we know nothing about the attributes of the properties in question. So maybe 3-beds formed a bigger chunk of the Q2 market while there were more 4-beds in Q3. Or perhaps conditions improved in South Dublin, and it formed a much bigger chunk in Q3 than in Q2. Ultimately we just don’t know.
It seems such a shame that having all this transaction price information out there, we can’t undertake any meaningful analysis of trends in prices… yet. I’m working with the tech guys at Daft and we’re hoping to match up addresses of property listings and property transactions. That way, we would know lots more about the properties sold, such as exact location, property type, and number of bedrooms and bathrooms. While this would inevitably be just a proportion of all transactions, and a small fraction of all listings, it would still allow the calculation of a substantive mix-adjusted price index of transactions, which would be a companion to the already existing asking price index.
Wish us luck!
FPL ,
Another benefit of this data is that we will be able to get an objective picture in relation to the data that the construction industry publishes in relation to demand for newly built houses.
For example in the US the ratio of new sales to second hand sales is about 1:5 i.e. for every new house sold five second hand houses are sold. We never had this data in Ireland.
At the top of the boom the CIF was calling for 90,000 new houses per year. As recently as June they called demand at 25,000 per year. (http://bit.ly/V7qSgB)
It will be interesting to see if we reach an equilibrium in relation to this ratio and to how it compares with other countries.
Kevin Hamilton ,
Ah jaysus. I expected better. You wrote multiple times about the limitations of the data but don’t hesitate to offers ‘facts’ and analysis based off data even a novice could tell offers little to no broad analytic usefulness.
“”Median prices have risen by 2% between Q1 and Q3 2012. Do not adjust your sets: yes, I wrote “prices have risen”!”” for example is not a fact. It needs about two pages of qualifiers to explain how it isn’t a fact. You offer it as a fact.
You’re also far too glib with the “IMF effect”. First year economics students are taught correlation does not equal causation, this seems to be a lesson you’ve already forgotten.
Graphs are excellent as usual, however the analysis is sadly lacking and far too tabloid in it’s attempt for easy soundbites and snippets.
Ernest Kinane ,
Are cash transaction sales included in the property price register as i believe these transactions would skew your analysis.When the state hires new workers in the future these employees, such as teachers will be employed at 30% less salary and be expected to pay a property tax as well as other increased taxes, this cannot result in a robust recovery in house prices.I also believe that reductions in rent subsidies in future budgets could put downward pressure on rents and make future landlords more reluctent to invest at current prices.The second property tax currently 200 euro may be increased in future affecting yeild.
Laura ,
Good points, but one thing that hit me hard when I looked up properties that had sold in the last year that I took note of and had my eye on was that EVERY ONE OF THEM went for significantly less than the asking price I’d seen on daft/myhome. Which really does bring me to question the use of the prior reporting from agencies and websites/aggregators. For example, the last two included one house that was advertised at 199,000 but in fact sold for 160k, and a second which advertised at 140 but sold for 130k. Thats a huge gap AND both were in Dublin (albeit north county Dublin which has a bigger overhang than south).
But whats most striking to me was huge gaps in known estates if you look up an estate or road over the 3 years covered – same property quite frequently was resold for significantly less, and I was unable to find any real increases, even in Dublin.
If banks do start lending though, this will justify the “now is a great time to buy” position, but sadly, I think I suspect that the vast majority of those who would like to will continue to be hampered by bank policy.
BV ,
I am currently selling a South Dublin property which has received huge interest indeed. I am strongly considering increasing the asking price by circa 5% based on same.
I think it must be acknowledged that this is a completely ‘unknown’ market situation where fear seems to be the biggest factor. But as I never saw my home as an asset but as a Home, I don’t actually feel I have lost, as I am merely relocating with a smaller budget but as price drops have been universal, there is actually no problem. I just don’t need a 5 bed home anymore.
Why don’t people talk about buying homes – property investment is a completely different ball game!!!!
Reports of our death are greatly exaggerated: existing house price reports respond | Ronan Lyons ,
[…] Browse in Property Market « First results from the property price register – the IMF effect and rising prices? […]
The first house price index based on the house price register | Ronan Lyons ,
[…] The Register contains no information, however, on property type or size. Without this information, the only vaguely reliable statistic on trends in property prices is the median price. And even that is of limited use, in a market with an anaemic level of transactions, as I pointed out earlier in the month. […]