The latest Live Register figures are out and Brendan Walsh leads a discussion of some of the trends emerging from the latest figures, noting that long term unemployment is now increasing. The detailed CSO database breaks down the figures by age, gender and specific location, which allows to analyse how our unemployment problem is changing.
Between December 2008 and June 2009, the total number signing on rose just over 127,000. In six months, Ireland witnessed an increase in the Live Register as large as that of the previous 18 months. It is not just the speed that has changed, though. The internal dynamics have changed also. Two trends in particular are worth noting: gender and location.
Sex…
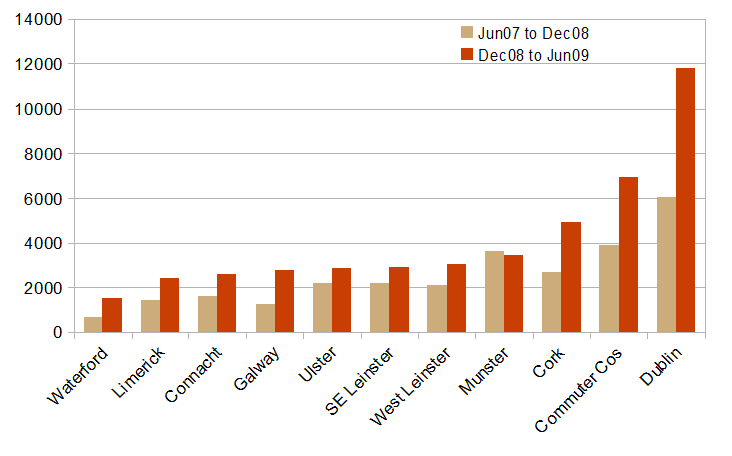
The first is gender: women are now driving increases in unemployment. Between June 2007 and December 2008, almost 100,000 of the 125,000 new signers-on were male. The equivalent figure since the start of the year is just over 80,000, a fall of 16%. At the same time, the number of new female signers-on rose by 64% to over 45,000. The breakdown in new female signers-on is shown in the chart below.

The figures allow one further breakdown: by age, with just two groups, over 25s and under 25s. Generally, women under 25 have been harder hit in recent months, especially in Connacht, where the rate of young women signing on has increased by more than 125%. The worst affected area for women over 25 has been Waterford, where unemployment has only really started to affect this group since the start of the year.
… and the city
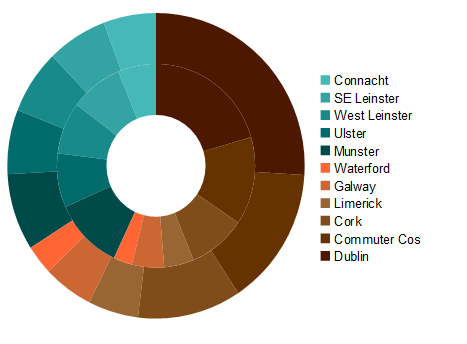
The second point to make is the urban/rural divide: cities are now driving increases in unemployment. 43% of the new signers on between June 2007 and December 2008 lived in outside Ireland’s main cities and Dublin’s commuter counties. Since the start of the year, though, there has been a significant decrease in the numbers signing on outside Ireland’s cities, particularly in Munster (down 27%) and South-East Leinster (22%).
On the other hand, the numbers signing on has increased in each of Ireland’s cities, and in Dublin’s commuter counties. Dublin (+29%) and Cork (+19%) have been worst affected. The counties with Ireland’s two biggest cities have contributed 37% of new signers-on since the start of the year.
The graph below shows where Ireland’s new signers-on have been coming from. The inner circle represents the increase between mid-2007 and end-2008, while the outer circle represents new signers-on since the start of the year. The brown and orange shades represent urban areas, while the turquoise shades represent rural areas. The increase in the urban areas is apparent.

Who has been worst hit? Visualising Ireland’s unemployment crisis | Ronan Lyons ,
[…] news from the last couple of months has not been good, though. About a year ago, I highlighted two important new trends in Ireland’s unemployment: gender and cities. The gender point remains valid. Whereas almost all of the increase in unemployment in 2007 and […]