Economists call those goods that you switch away from when you become wealthier ‘inferior goods’. People can probably think of plenty of examples in their day-to-day lives – “upgrading” from frozen pizza to delivery pizza to Italian restaurants, for example, or from own-brand coffee through regular coffee to fairtrade coffee. The government provides a range of services in the economy. Is there any evidence from Europe that as we became richer over the past decade, we moved away from the government? A definitive answer is probably a thesis in itself, but no harm to have a look at the front line of evidence…
The typical European government comprised 46.8% of its own economy in 2008, up slightly from 46.4% in 2000. The proportion of national income spent on military expenditure fell over the same period, though, from 1.7% to 1.4%, meaning non-military government expenditure rose from 44.7% to 45.4% in the eight years to 2008. At the same time, the average European grew 14% richer between 2000 and 2008, suggesting perhaps a positive relationship between government expenditure and income.
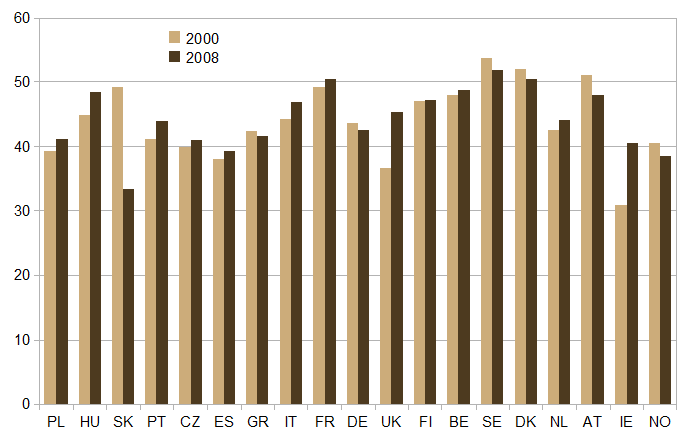
As should be expected, though, government expenditure (stripping out defence) varies considerably from country to country. In Sweden, more than half the economy is controlled by the government – although the figure fell slightly from 54% in 2000 to 52% in 2008. At the other end of the spectrum, in 2000 the government in Ireland spent less than one third of that country’s GDP. The Irish government has since substantially increased its proportion of economic activity – to 41% of GDP in 2008, and substantially higher if one uses GNP, which is significantly smaller than GDP in Ireland, due to the presence of FDI. The UK saw the second biggest relative increase in government, with the government 45% of the UK economy by 2008, up 9 percentage points.
A country going the exact opposite direction to Ireland and the UK is the Slovak Republic. Non-military government expenditure as a proportion of output was almost 50% in 2000, the 4th highest in Europe. By 2008, that proportion had fallen to just 33%, the lowest in Europe. Slovakia’s remarkable change in ranking in a relatively short period of time was achieved while per capita growth was the highest in Europe, an average of 5% since 2000. Coincidentally, ironically or otherwise, the second highest growth per capita growth rate was in Ireland, home of the fastest growing government, where output per head rose 4.6% a year in the same period.
The chart below shows the government proportion of the economy for 19 European states in 2000 and 2008. They are arranged from left to right in order of increasing GDP per capita. Nine of the countries saw their governments substantially increase in size over that period (i.e. by more than three GDP percentage points), while just five saw their governments substantially decrease in size. It is interesting to note that, Slovakia aside, the poorer countries generally saw their governments increase in relative size, while the wealthier states, such as Austria, Sweden, Denmark and Norway (but not of course the UK or Ireland) saw their governments shrink in relative size.

Leave a comment