It’s often said that one of the big problems when it came to Ireland’s property market bubble was that the volume of trades was simply too high. Everyone was getting in on the act, and it was a real case of the last person standing is going to be left, just like musical chairs, without somewhere safe to sit at the end of it all. If that story holds, then differences across counties in how many properties were sold over the boom years should give an indication of the likely extent of correction underway.
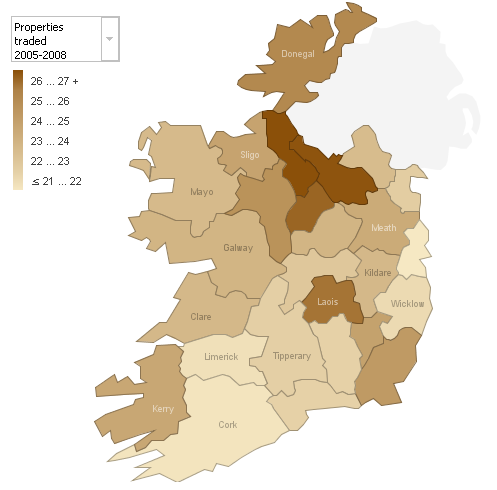
While we don’t have exact statistics about how many properties were traded by county over the last ten years, data on completions, mortgage approvals and existing housing stock – all of which I needed for the negative equity calculations – do allow a reasonable estimate of the number of transactions by county and by quarter. The map below shows the approximate percentage of properties traded in a county between 2005 and 2008.

As you can see, the scale is between 20% and 30%, with on average almost one in four properties changing hands in that four year period. Laois plus the mid-west corridor are pushing the top end of the scale, while in proportionate terms Dublin and Cork are at the bottom of the scale.
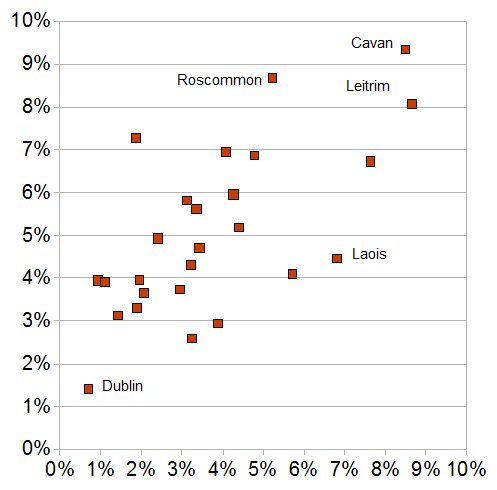
Nice graph, but does that say anything at all about the current state of the market? It turns out it does, as the scatter below shows. It plots on the vertical axis the total stock of properties for sale on daft.ie yesterday evening (as a percentage of the total number of households in the county). On the horizontal axis, it plots the percentage of transactions greater than 20% from the indicator outlined above, as an albeit crude measure of how heated a county’s property market got, not in terms of price but in terms of number of transactions.

You can see that there is a clear relationship between the number of transactions in the later boom years and the stock currently for sale. As is clear from other measures, the concern for the medium to long-term fate of particular counties’ property markets is greatest in a small number of counties. The large numbers seen currently trying to sell in those counties were those stuck on their feet when the music stopped.
Leave a comment