After Latvia’s 2006 general election, four parties with 60% of the vote formed a new government. GDP growth was above 10% and all seemed well. Since the start of the global recession, however, Latvia’s economic figures have become truly shocking. Unemployment rose from 7% at the end of 2008 to 17% in April. The economy shrank by one sixth in the early part of 2009, and it’s now the government deficit, not GDP growth which is expected to be in double-digits this year and next. The four Latvian government parties got just 22% of the vote in the weekend’s European elections – none of them got above 10% of the vote.
Latvia is of course not the only EU economy to be left reeling in the wake of the global economic recession. Its cumulative government deficit this year and next of almost 25% of GDP is matched by the UK and exceeded by Ireland. In both those countries, support for the governing parties fell more than 20 percentage points between the last general election and last weekend’s Euro election.
Of course, turnout tends to be lower and there is a history of people lodging so-called “protest votes” in European elections. Much of the commentary early this week has highlighted a slight move to the right around Europe, among the protest votes. That may be somewhat counterintuitive to some, particularly as laissez-faire regulation of financial systems is viewed by most as having got us into this mess.
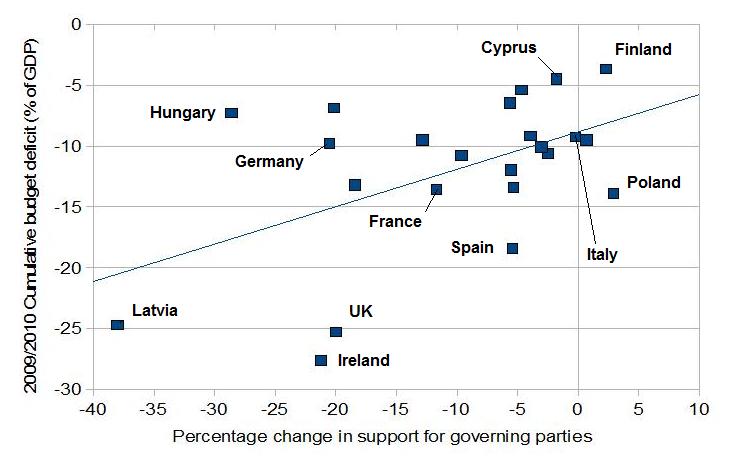
A scan through the full European election results reveals a relationship of a less idealogical nature. The protest at the weekend was bigger on average in those countries with a larger economic mess. The graph below shows this is a somewhat crude fashion. It has on one axis the percentage change in support for the governing parties in each country, from Latvia’s -38% to the increase in support for ruling parties in Finland and Poland. On the other axis, as a proxy for how messy a country’s economic circumstances are, is a country’s cumulative government deficit in 2009 and 2010, as estimated by the European Commission and expressed as a percentage of GDP.

Naturally, those data won’t capture everything. (It could be argued, for example, that the 20 percentage points fall for Estonia’s governing parties means the citizenry’s attitudes towards the government’s fiscal rectitude – the cumulative budget deficit this year and next is likely to be only 6.5% of GDP – than the sharp economic contraction going on around the government.) Also, the scatter isn’t a neat line – each country of course has its own nuances.
But it’s probably safe to say from this evidence that the protest votes were not delivered indiscriminately. On average, the poorer a government’s management of public finances, the more it got punished in the European elections.
EGaffney ,
A negative coefficient on a budget deficit axis is a surplus, Ronan. 😉
Ronan Lyons ,
Hang on, governments can run surpluses?!